
Climate Change in My Backyard Activity Guide
Unit 3: Earth system responses to natural and human-induced changes
In Unit 3, students learn how living things and ecosystems respond to and are impacted by changing climates. Students learn about how plant life-cycle events can be used to understand climate and how they have been used in the past. They participate in Budburst, a national citizen science project, and study how changing climates impact the timing of plant life-cycle events. Students explore the impacts of changing climates on plant migration by calculating seed dispersal rates for a variety of plant species and predicting whether they will be able to migrate quickly enough to keep pace with changing climates.
Activity 3.1: Preparing for Budburst
This activity serves as an introduction to phenology and project Budburst, and will prepare students to start collecting data. In this activity students learn how to use the Budburst website, begin to collect and record data on plant phenology, and add that data to the Budburst database (data collection will be ongoing throughout the rest of the curriculum).
NOTE: Budburst data collection can begin at any point in the curriculum. Before you begin data collection, implement Activity 3.1: Preparing for Budburst and continue making observations as often as possible so students are able to observe each phenological event.
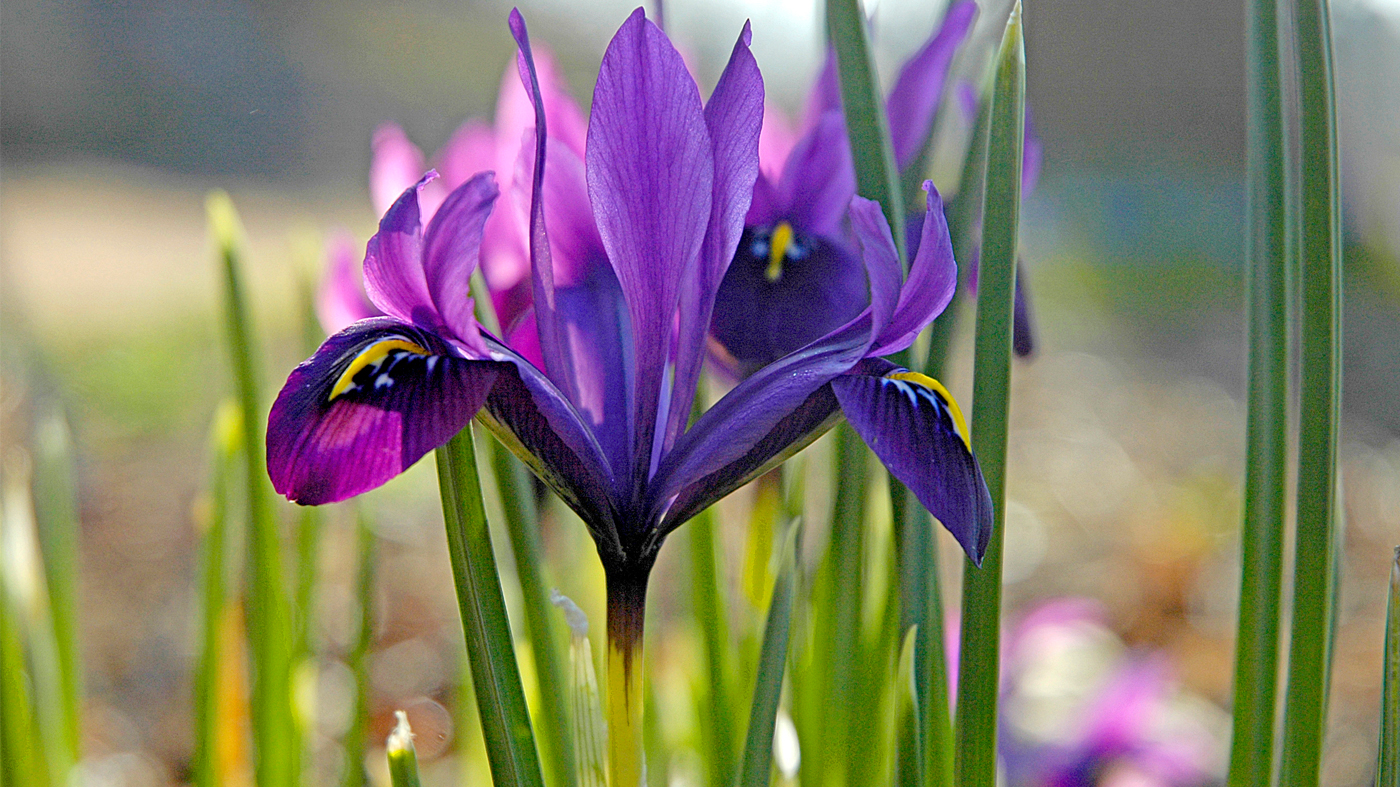
- Introducing Budburst: Students are introduced to the concept of phenology, the timing of periodic life cycle events. Students begin by discussing life cycles of organisms and the environmental factors that can impact those cycles.
- Plant ID and Dichotomous Keys: Students make observations of plants unfamiliar to them, create a field guide for their plants, and practice identifying other plants by using their classmates' field guides. Students then learn how to use a dichotomous key to identify plants, and use the keys to identify the plants that they will be collecting data on for Budburst. This is an outdoor activity, but can also be done inside on collected or purchased flowers/plants.
- Budburst Data Collection: Students collect data on their chosen plant species throughout the growing seasonand enter it into the Budburst website over a period of weeks or months. Students can write the data on the Budburst data collection sheets Plant ID sheets and phenophase guides are available on the Budburst website.
Activity 3.2: Impacts of Climate on Forest Succession
- Tree Identification Activity – See the Forest for the Trees: Students learn how to identify the most common trees found in a local forest using a dichotomous key. They explain and identify common tree features such as leaf arrangement (opposite vs. alternate), leaf complexity (simple vs. compound), leaf shape, and leaf margins. This activity is in preparation for part 2, a study of local forest succession. Students practice identifying leaves on trees around their school.
- Is the Environment Really Changing? A Study of Local Forest Preserve Succession: Students describe and give examples of the progression of several stages for a local environment such as a forest preserve or an old field. Students collect data on the species distribution for an area and based on that data predict past and future species composition of a local environment. Students use basal area, relative density, relative dominance, and other importance values for each plant species to determine how the forest is changing and how natural succession may be impacted by a changing climate.
Activity 3.3: Climate and Forest Ecosystem Services
This activity ties the concepts of ecosystem services and climate change to the forest succession activity. Students will learn about climate sequestration, and brainstorm what types of trees can sequester the most carbon.
Activity 3.4: Plant Phenology Data Analysis
- Historical Phenology Data: Students will learn the story behind more than 150 years of plant phenology data collected in Concord, Massachusetts. Then, they graph plant phenology data and draw conclusions about how climate and climate change affect plant phenology.
- Graphing Historical Data: Students graph plant phenology data and draw conclusions about how climate and climate change affect plant phenology.
- Explaining the Variation: Students will determine if the variation in first flowering date in Concord, Massachusetts, can be explained by temperature (maximum, minimum, or mean) or precipitation (annual rainfall).
- Budburst and NASA Green-up Data: Students review and compare historical data and their Budburst data, to NASA Normalized Difference Vegetation Index (NDVI) visualization and graphs. Students will discuss how Budburst can contribute to our understanding of plants' responses to climate change.